STRATEXA Get in touch
STRATEXA strategy · transformation · execution FR DE EN

The answer is in your data. I find it, and I show you how.

I am neither a consultancy nor one more tool. I work alongside your teams, and everything I build runs on its own, inside your organisation.

The decision is yours: you run the company, you are the number two, or you answer for a department. I am called in when a call has to be made without a reliable answer, and nobody on your side has the time or the means to produce one.

Thirty minutes on the phone →

One person and their network

Nadim Dziri

Nadim Dziri, engineer, EPFL. Twenty years building and leading: sales operations for a telecoms operator, general management in retail. Then data engineering, programming and AI, through to applications running in production.

The method has never changed: find the data that matters, structure it, share it across the team, draw the priorities from it, and see them through.

Why one person rather than a consultancy? Because I make the round trip between management and the technical side: your processes, your systems, your data, with today's tools, AI included, and knowing where they stop. I rely on your teams, who know the ground better than anyone, and on outside specialists when a subject calls for it. What I build is made to be shared, so that your teams can do it again without me. Two or three clients at a time, no more.

When to call me

Track record

Events · procurement, energy, mobility
−31% CO₂e
‘We have to measure our carbon footprint. How do we make it more than a cost?’
The carbon footprint had never been calculated in detail. Rather than invent data, it was built from what was already there: the accounting system, logistics, tills, surveys, each raw record becoming, step by step, kilograms of CO₂e. All of it brought together in a single web interface, with a NetZero reduction path and a confidence indicator. Eleven carbon footprints in three years, emissions down by 31%, and a new service for exhibitors. The tool is online and has since become a service in its own right, which I run: carbondata.ch.
Software · purchase decision support
30,000 listings analysed
‘Is this boat worth the asking price, and what will it cost me afterwards?’
Buying a second-hand boat is a wager: the asking price says nothing about the work that follows, even though a refit often costs less, both in use and for the planet, than buying new. Thirty thousand listings were analysed to place a boat within its market, and the work is costed on algorithms drawn from the trade itself. The report sets out the equipment present and missing, compares the shortlisted boats, and flags the points to check. The buyer knows the full cost before travelling, and knows which questions to ask. Online: nauticheck.io.
Events · pricing
2.3m order lines analysed
‘Our catalogue has become unreadable and unmanageable.’
Booking a service meant ordering dozens of items. 2.3 million order lines were analysed to see at last what was really selling and which products had had their day. Two thirds of the value rested on a single step of the customer journey, booking the floor space: that step was reworked first. The catalogue was rebuilt into modular packages for the sales teams, and the booking route became the same for every client. It is online today as a configurator, winner at the Best of Swiss Web Awards.
Retail · discount policy
Fewer sales, more margin
‘We discount earlier and harder every year. Can we stop?’
Every year the sale began earlier and ran longer: private events, previews, then the official sale. Nobody had decided this; the markdown had simply settled in, and prices were changed in three tools, one of them a list kept by hand. The fear every retailer shares is losing volume by giving up discounting. Two seasonal ranges were taken off the floor, twenty thousand items moved elsewhere, and signage cut to three formats. Sales did fall, and the margin rose all the same: discounts down by 19% in a year.
Retail · operating costs
−22% waste
‘What do we actually gain by cutting our waste?’
Sorting waste cost money before it earned any. Nobody had ever added up the goods thrown away, recorded all along: almost all of it came from a single department. Unsold stock stopped being waste and became a decision, in this order: cook it, sell it at a reduced price, sell it in an end-of-day basket, give it away, and compost it last. Sorting passed to the teams, which took a line out of the cleaning contract, and single-use packaging followed. Goods written off, packaging and upkeep fall together by 22% in a year.
Retail · margin per square metre
Twice as much on equal space
‘This department is not working. Is it the brand or the location?’
A department store sells square metres above all, yet tying performance figures to floor space is rarely done with any precision. The floor plan was turned into a heatmap: every location carries its turnover, its margin, its discounts, its average price and their trend, published monthly. Price and margin between neighbouring locations differed by a factor of two, on equal space. A camera-based count separated the quiet areas from those where people walk past without buying. The whole was standardised and semi-automated to steer every zone of the store.
Retail · productivity
31% of the time
‘My teams work hard. Why does profitability not follow?’
Profitability had been falling for three years and staff costs had already been squeezed several times. Fifty interviews across twenty-five roles measured the time each task took, reconciled to one hundred per cent and then scaled to the whole site: 31% of working time went to low-value work. Those tasks were first brought into one team, then standardised, and finally automated. 14.6 full-time equivalents moved onto profitable work, and the site rose from eleventh to first for customer satisfaction.
Catering · business development
+22% a year
‘This department is running half empty. What do we do with it?’
The department was losing a little more revenue each year, and the profit and loss account pointed to the obvious way out: cut the floor space, at the cost of the brand. The inventory said otherwise. The walls and the machines were there, already paid for, idle for part of the day. A client was found in an entirely new sector, with guaranteed volume. The whole process, from order to invoice, was simplified and automated to secure an above-average margin. Eight months from first contact to first delivery, and the department is growing by 22% a year, without a square metre more or less.
Telecoms · coverage and acquisition cost
From 46 to 78 points of sale
‘Where should we act, and to do what?’
The question put was whether to open shops; the real question was what to do in each region. The territory was cut into 500-metre cells, scored on seven dimensions, from population to revenue per customer, from network coverage to service quality. Customer postcodes mapped the true catchment area of each shop, and therefore what an opening would take from its neighbours. Each area got its own plan: open, move, enlarge or put right. The estate grew from 46 to 78 points of sale, and direct sales, 40% cheaper than a reseller, grew with it.
Telecoms · product, monetisation
+CHF 1m in revenue
‘We spend more than our competitors. Where do we start?’
A European benchmark placed the operator far behind its peers. Seventeen services, each tied to a loss of value measured in the systems already in place: shop contact statistics, read as an instrument of measurement, showed that 14% of visitors left without being served, twenty-seven thousand sales lost every year. A free and haphazard practice became a range of professional, chargeable services and brought in, within a year, one million francs of additional revenue.

The files in the shadows

Your systems (ERP, finance, CRM) record everything and answer nothing. So your teams export, improvise, and get their answer. It is the sensible thing to do, which is why no ban has ever stopped it.

Every question left unanswered creates one more source: an export, a workbook, a macro. And every source becomes a competing version of the truth, noise around your figures. That noise was already rising on its own, and AI is making it rise faster.

IT HOLDS IT CREAKS IT DIVERGES IT DECIDES FOR YOU
The natural slope With AI, faster With Stratexa, the goal

And that noise costs you four times over:

Time
Hours lost
Redoing every month what should run on its own.
Reliability
Unchecked figures
Finding the error once the figures are signed off.
Autonomy
Dependency
Depending on one person to keep this information current.
Revenue
Missed opportunities
Time and knowledge that could have gone to the customer.

What I offer you

An answer that cannot be checked is worth nothing: that is what creates the noise. The answer I deliver can be broken down and defended. Every figure is recalculated from its source, can be explained in one sentence, and holds up in front of your executive committee. Checks run on every execution, and nothing is released if one of them fails.

I do not stop at the measurement. The answer reveals a process to simplify, a report to automate, a rule to put right. I put that in place with your teams, then I measure the effect.

Sometimes the answer is to do nothing, but to make that choice knowingly and calmly: costed, documented, filed. The question stops taking up your time.
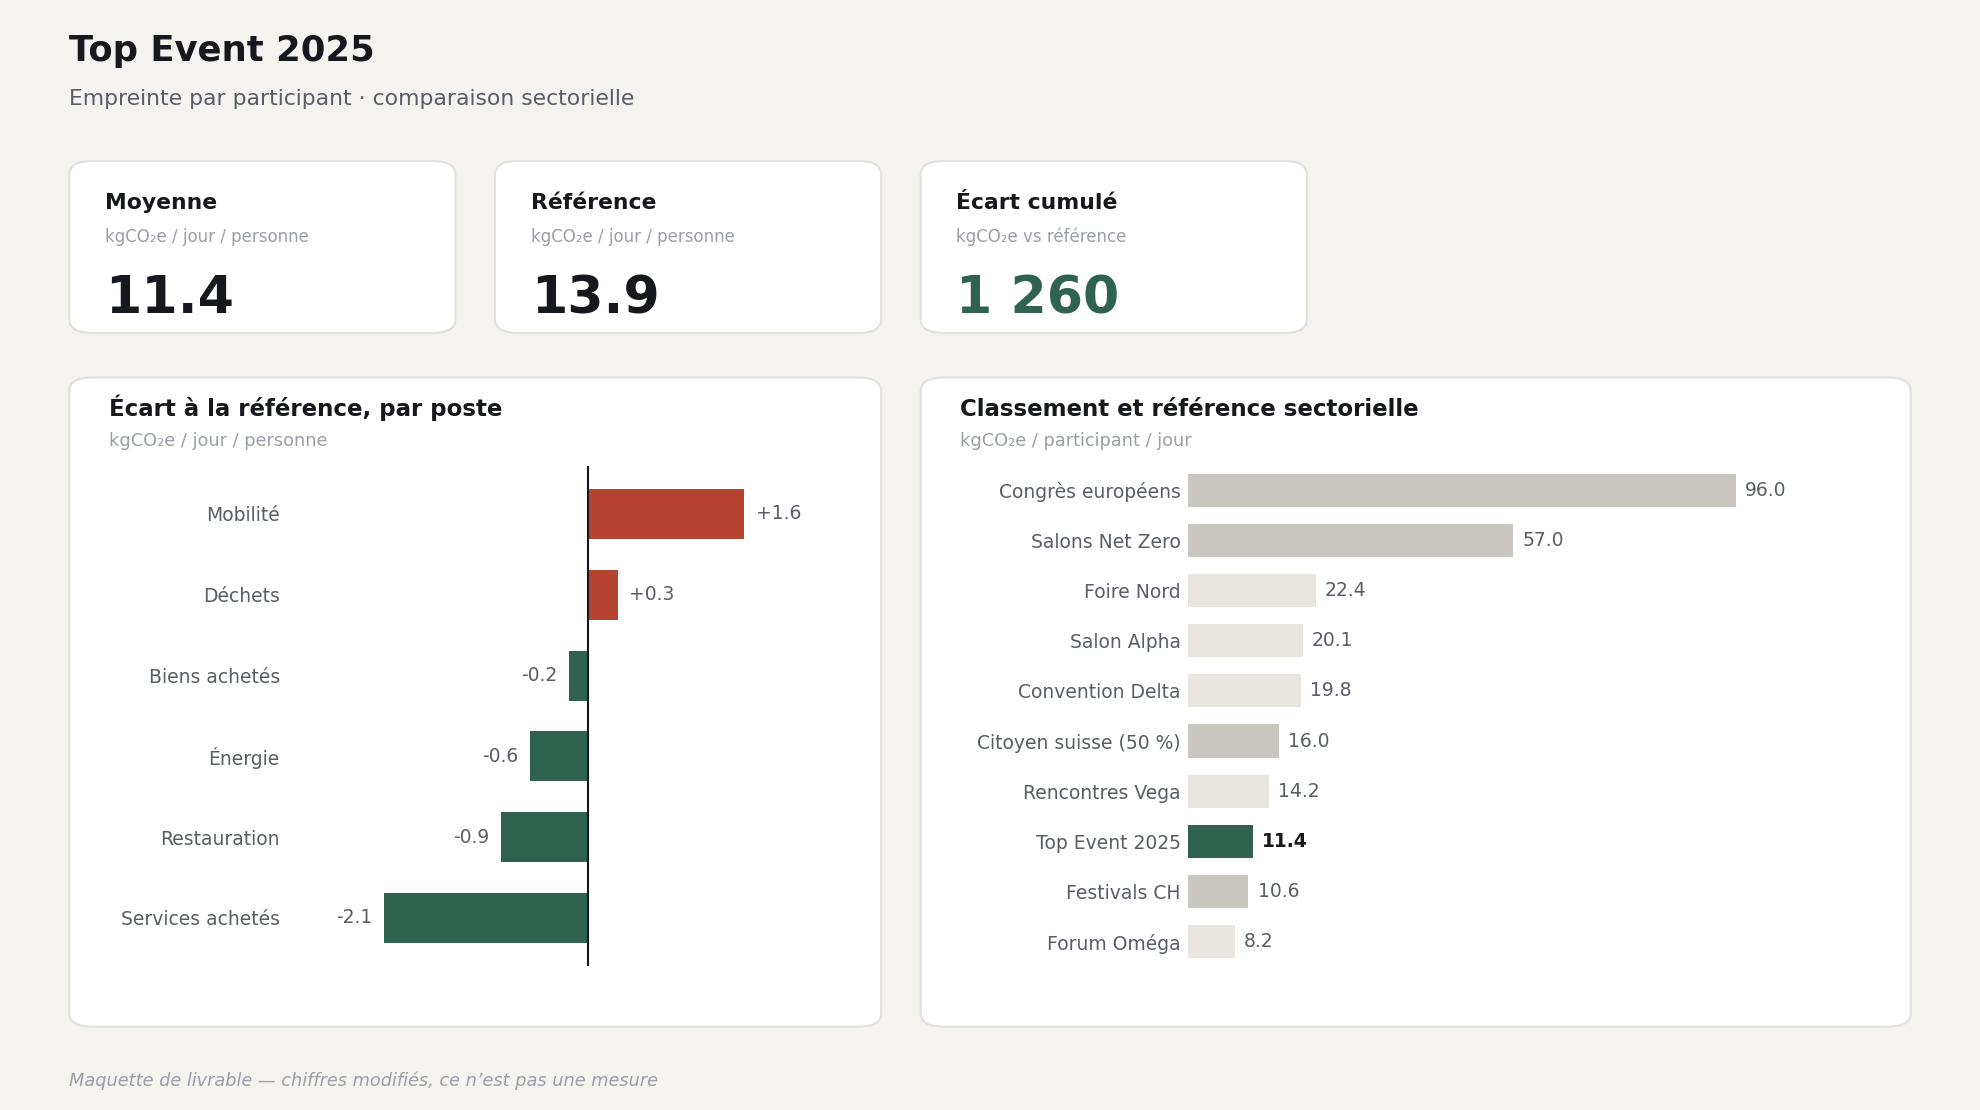
Dashboard: carbon footprint per attendee, gap to the reference by category, and sector ranking.
CO₂e per attendee, gap by category, standing in the sector.
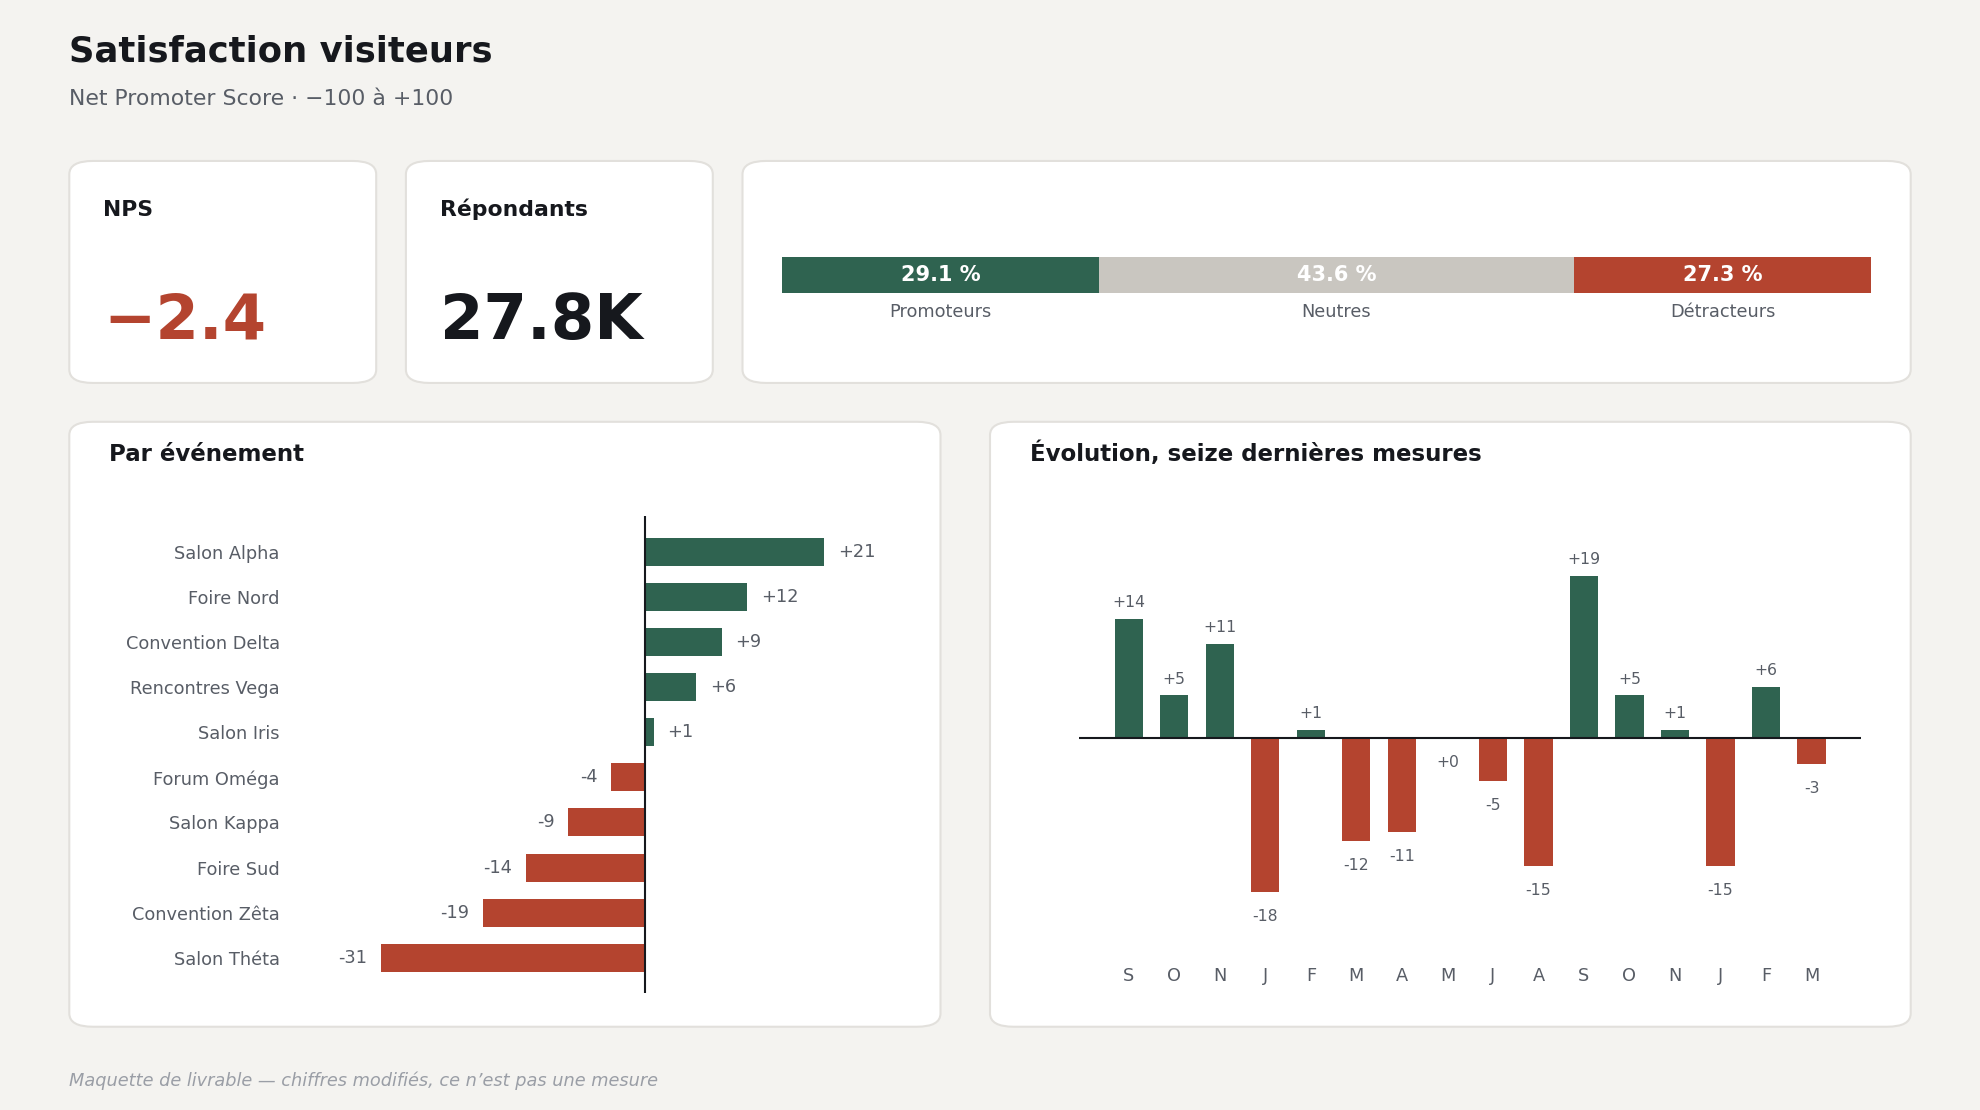
Dashboard: satisfaction score, split between promoters and detractors, ranking by event and trend across sixteen measurements.
Satisfaction: the score, what makes it up, and how it moves.
What these two screenshots show, and what they do not

Two dashboards genuinely delivered, with labels anonymised and figures altered: they show the shape of what you receive, not a result.

AI to explore and to code. Never to decide.

Used badly, this technology exponentially amplifies the very problem it is meant to solve. Used with thought and within bounds, it gives what is expected of it: clear information, a decision, an improvement, and, through code, the automation of a great many processes, particularly those of low and medium value.

YOU AI STRATEXA the figure you decide on

No black box. The code is readable, it sits with you, and every business rule lives in a file your teams can change. That is also what keeps the work affordable: a project fits within a fixed fee of CHF 9,000 to 15,000.

How it works

Step 1
First contact

You describe what troubles you in your figures or your processes; I tell you whether it is something I can take on, and what answering it would require.

Lead timewithin a week
Pricefree
Effort on your sidethirty minutes
Step 2
The specification

We frame your question, I explore your data. You receive a written assessment:

  • The question, framed so that a figure can answer it.
  • The sources behind it: where the data sits, in what state, what is missing.
  • The verdict: feasible, partly feasible, or not. And why.
  • The proposed scope, and the project at a firm price.

If the answer is no, you pay for this step only, and you know why.

Lead timewithin two weeks
PriceCHF 2,500
Effort on your sideone day
Step 3
The project

A precise scope, chosen for what is at stake. I take the calculation out of the files, put the checks in place, and set up a visual and a semi-automated report:

  • The calculation runs on its own at your end.
  • An online dashboard in place of an Excel file.
  • The method note: where each figure comes from.
  • The list of checks, and what happens if one of them fails.
Lead timethree to five weeks
Pricefixed fee, CHF 9,000 to 15,000
Effort on your sideabout ten days in all over five weeks, shared between you, finance and IT
Step 4
Running it
What happens once the project is finished

The calculation runs at your end, and you keep control of it. Your teams, or your IT provider, can open it, read it and change it.

What runs keeps running, with no subscription. If your systems change, if a rule moves on or a new question comes up, I remain available.

Lead timeonce the project ends
Pricenone, unless you ask for more
What the specification commits you to, and what it does not promise

The specification is not a promise of results, it is an assessment: the commitment on the project comes only once the data has been seen.

Thirty minutes on the phone →

What Stratexa does not do

Your data

It stays with you, in Switzerland, and goes nowhere without your written agreement.

AI helps me explore and write the code. It works on the structure of your systems (table names, column names, volumes), never on what they hold.

Confidentiality, Swiss data law, deletion at the end

Were any processing to involve the content itself, it would take place in Switzerland, on open models hosted in Switzerland, at Infomaniak for instance, and I would ask you first. I sign a confidentiality agreement before touching your systems. The data you entrust to me serves only to answer your question, and the processing complies with the Swiss Federal Act on Data Protection. At the end of the engagement, I delete everything left on my side if you ask me to.

Thirty minutes on the phone, to see whether I have something to bring you.

Write in one line what troubles you most in your figures, and I will call you back.

Message sent. I will reply within two working days.

Sending failed. Please try again in a moment.

Your message comes straight to me. Nothing is passed to a third party.